Transits of Venus from -2000 à +3000
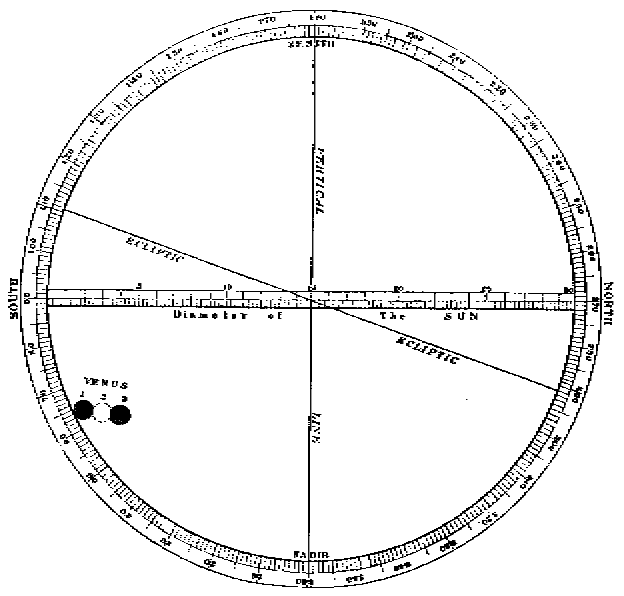
Horrocks observation of the 1639 Venus transit

Horrocks observation of the 1639 Venus transit
Presentation
- The canon includes all the transits of Venus from -2000 to +3000.
- They are computed for a geocentric observer.
- Some grazing transits visible only on some points of the Earth have been also included (eg -943)
- The text file is organized on the basis of one record per transit
- The difference between TDB and UT is quadratically
extrapolated in the distant past or in the future from known values of
TD - UT.
Download your Venus file (~ 10 kB) |
    JD             date (TU)      R_S(")  Delta(") ratio   R_P(")
2453164.848   8/ 6/ 2004   8:20   945.4   -626.5   0.663   28.88
t_1 t_2 t_3 t_4 l_beg l_end phi V(°/day) lat node td-tu(s) 5: 13.6 5: 32.8 11: 6.6 11: 25.9 98 14 23 1.60 -0.17 -1 68.4
JD Date of mid-transit in Julian days (dynamical time) date Date of mid transit in UT R_S Radius of the Sun in arcsec delta Distance at closest approach in arcsec (negative when south of the centre) ratio Ratio delta/R_s R_P Radius of the planet in arcsec t_1 First contact in UT t_2 Second contact in UT t_3 Third contact in UT t_4 Fourth contact in UT l_beg Longitude of the sub solar point at ingress l_end Longitude of the sub-solar point at egress phi Latitude of the subsolar point V Relative displacement of the planet on the solar disk in deg/day lat Ecliptic latitude of the planet node +1 : ascending node, -1 : descending node TDB-UT value of TDB-UT in sec(measured or extrapolated)
|
Period
|
Desc. Node
|
/cy
|
Asc. Node
|
/cy
|
|
-2000 to 3000
|
36
|
0.72
|
31
|
0.62
|
|
theory
|
0.65
|
0.54
|
       JD          Date UT     time   Sun R   min D    ratio  Venus R
                                       "       "                 "
   2317110.722   7/12/ 1631   5:19   975.0   939.4     0.964   31.59 :: not seen by Gassendi
   2320030.268   4/12/ 1639  18:25   974.7  -523.3     0.537   31.58 :: Horrocks
   2364408.722   6/ 6/ 1761   5:19   945.0  -571.9     0.605   28.86
   2367328.434   3/ 6/ 1769  22:25   945.3   608.8     0.644   28.87 :: Cook at Tahiti
   2405866.671   9/12/ 1874   4: 6   974.6   831.1     0.853   31.57
   2408786.213   6/12/ 1882  17: 6   974.3  -634.9     0.652   31.55
   2453164.848   8/ 6/ 2004   8:20   945.4  -626.5     0.663   28.88
   2456084.563   6/ 6/ 2012   1:29   945.7   554.4     0.586   28.90
   2494622.620  11/12/ 2117   2:48   974.3   723.0     0.742   31.55
   2497542.171   8/12/ 2125  16: 2   974.0  -733.8     0.753   31.53
   2541920.987  11/ 6/ 2247  11:33   945.7  -692.2     0.732   28.91
   2544840.700   9/ 6/ 2255   4:38   946.0   492.9     0.521   28.92
   2583378.582  13/12/ 2360   1:43   973.9   627.1     0.644   31.52
   2586298.125  10/12/ 2368  14:45   973.5  -836.3     0.859   31.49
The most central transits (min D/R < 0.15)
       JD          Date UT     time   Sun R   min D     ratio
                                       "       "
    1876250.522  22/11/  424  23: 3   976.1     9.0     0.009
    1654359.604  22/ 5/ -183  23: 3   943.3   -11.2     0.012
    1565603.466  22/ 5/ -426  18:41   943.1    61.6     0.065
    1743115.746  23/ 5/   60   3:21   943.4   -86.3     0.091
    1965006.472  23/11/  667  22:22   975.9   -96.7     0.099
    1787494.575  22/11/  181  23:38   976.3   116.7     0.120
    1476847.323  22/ 5/ -669  14: 5   943.0   139.2     0.148
The most grazing transits (min D/R> 0.900)JD Date UT time Sun R min D ratio " " 1077447.000 20/11/-1763 23:10 977.3 967.2 0.990
1923547.750 22/ 5/ 554 4:50 944.0 931.7 0.987
2317110.722 7/12/ 1631 5:19 975.0 939.4 0.964 :: Kepler admonitio
2675054.088 13/12/ 2611 13:35 973.2 -931.3 0.957
1435390.345 19/11/ -783 13:59 977.0 -902.7 0.924
2012303.884 22/ 5/ 797 8:30 944.2 867.7 0.919
1296415.319 23/ 5/-1163 11: 7 942.8 -860.9 0.913
2808189.371 16/ 6/ 2976 19:45 946.7 -853.8 0.902The doubtful or partial transits (min D/R> 0.900)JD Date UT time Sun R min D ratio " " 1385171.464 23/ 5/ -920 16: 5 942.8 -943.3 1.001The longest transits (min D/R> 0.900)JD Date UT time Sun R min D ratio " " 1876250.522 22/11/ 424 23: 3 976.1 9.0 488.5
1965006.472 23/11/ 667 22:22 975.9 -96.7 487.0
1654359.604 22/ 5/ -183 23: 3 943.3 -11.2 486.9
1565603.466 22/ 5/ -426 18:41 943.1 61.6 486.7
1787494.575 22/11/ 181 23:38 976.3 116.7 485.8
1743115.746 23/ 5/ 60 3:21 943.4 -86.3 485.4
1476847.323 22/ 5/ -669 14: 5 943.0 139.2 482.2
1831871.885 24/ 5/ 303 7:26 943.6 -157.7 480.5
2053762.417 23/11/ 910 21:27 975.6 -206.6 478.5
1698738.635 23/11/ -62 0:15 976.5 230.5 475.4
1388091.177 21/ 5/ -912 9:14 942.8 221.1 475.1
1920628.029 24/ 5/ 546 11:30 943.8 -232.9 472.7
2142518.372 23/11/ 1153 20:36 975.3 -307.7 465.9
1299335.039 21/ 5/-1155 4:27 942.8 296.5 464.4
2009384.172 24/ 5/ 789 15:24 944.0 -306.2 462.2
1609982.685 23/11/ -305 0:30 976.7 335.5 460.8
© F. Mignard. Last udpate 7/12/07