(not intended to support any publication)
************************
The optical observation of a star is limited to the photosphere,
deeper, as the optical opacity increases, the photons are diffused and
the emitting matter is not directly observable.
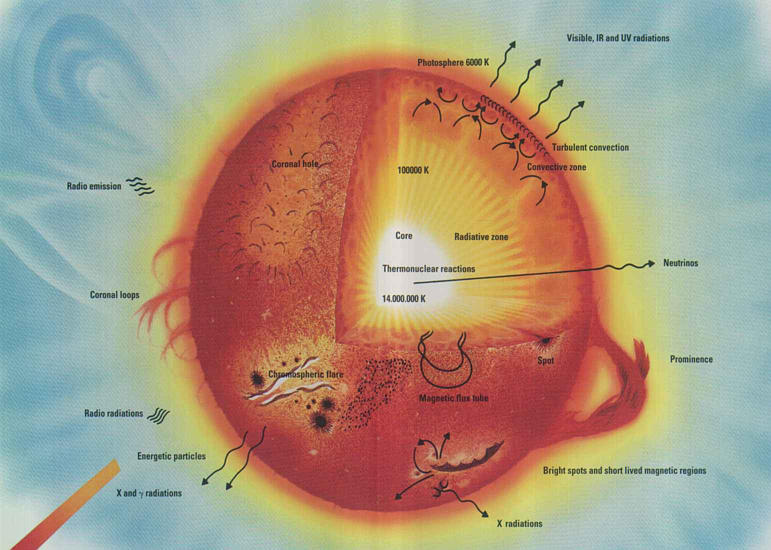
The case is the same for the sun. our closest star. The optical observations
are limited to the outer zones and the observed features are related to
the external layers, photosphere, chromosphere and corona. The core, in
which occur all the nuclear reactions producing the solar energy
is not visible, there is then no possible measurement of the local temperature
which govern the balance of the reaction rates (p-p reaction versus carbon
cycle). That is true for the whole electromagnetic spectrum and only the
neutrinos produced inside the sun are directly emitted in space. The temperature
in the core could be deduced from a precise determination of the spectrum
of neutrino but even the flux of this particle is highly difficult to measure.
In addition and as a result of the collation of the early measured neutrino
flux with the temperature predictions due to helioseismology, the neutrino
is now considered to have a non-zero mass and oscillating into 3 states,
only one of those being observable.
The observation of the solar oscillations is another way to study the
solar interior, doing a seismic sounding like it is possible to diagnose
a break into a bell, or to study the internal structure of the Earth. As
an exempla, the late determination of the deep of the solar connective
zone comes from those measurements.
The physical properties of the internal zones are deduced from the
temporal spectrum of the acoustical eigen modes. A large number of
those mode is excited by a random source (likely in the convective
zone), giving observable stationary oscillations due to the complex
interference of independent eigen spherical modes.
 |
2 kinds of waves are looked for: acoustic waves, for which pressure
is the restoring force , gravity waves for which buoyancy is the restoring
force.
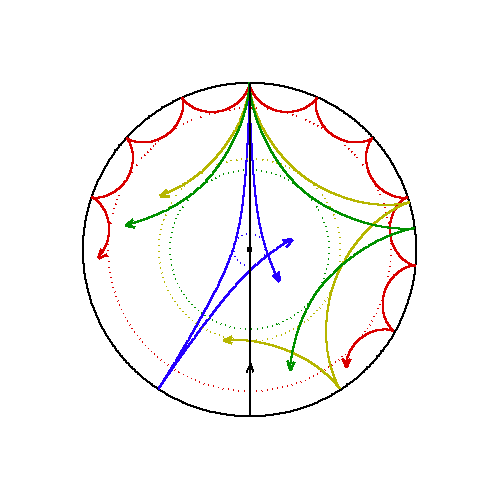
The Figure shows a diagram of ray paths of different acoustic waves inside of the Sun. The acoustic waves are reflected on top by a huge drop in density near the surface. At the bottom, the ray paths are bent as the sound speed increases with depth, as the temperature do. . The angle at which the wave reflects determines how far it will penetrate: The shallower the angle, the shallower the penetration. |
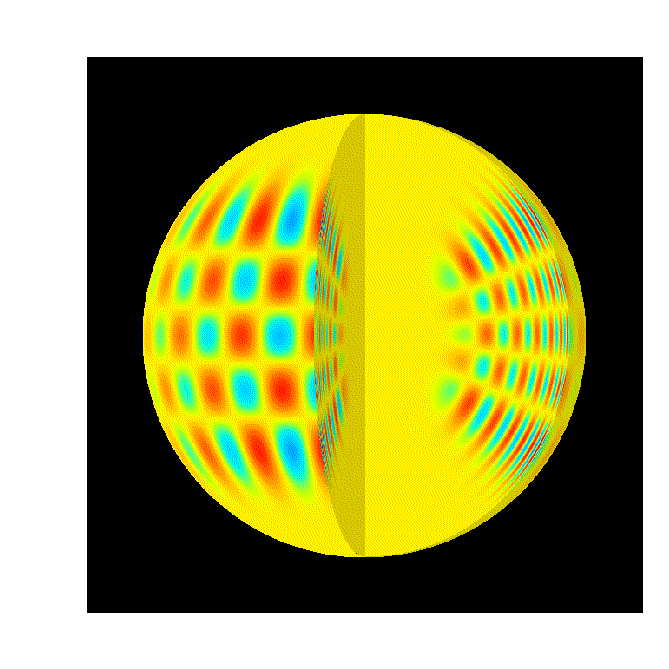 |
An acoustical mode in 3D.
The number of nodal lines at the surface defines the ray path of the acoustic wave and due to the refraction, the oscillation associated to a given mode is limited in depth, the modes with the largest surface pattern going the deeper into the solar core. An eigen mode is defined with 3 numbers, l and m related to the number of nodal lines on the surface and n, the number of nodes along a radius. Each eigen mode oscillates in a specific resonant cavity. Gravity modes are known for hot stars only, but remain unidentified in the solar case (surface modes excepted, but with a high image resolution). |
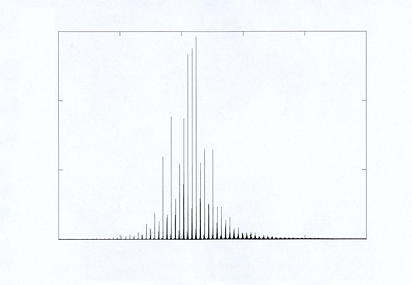 |
Example of a stellar spectrum of acoustical modes: the solar spectrum
due to the SoHO/GOLF
observations, using several months of uninterrupted observations. SoHO
operates since 1996 from a halo orbit around the "point de Lagrange" L1,
1.5 million km from the Earth.
The surface velocity is averaged over the visible disk. That is the case for a star for which no spatial resolution is achievable. |
In the resonant cavity specific to an eigen mode, the variations of
the physical properties of the stellar sphere (or more precisely the sound
speed at a given distance of the centre) govern the wave propagation
and then the frequency of the mode. The modes are then not exactly
equidistant as can predict a crude model. The frequency pattern is then
the peculiar signature of a star.
The maximum of amplitude corresponds to 3 milli Hertz oscillations
for the sun, a close to 5 minutes periodicity.
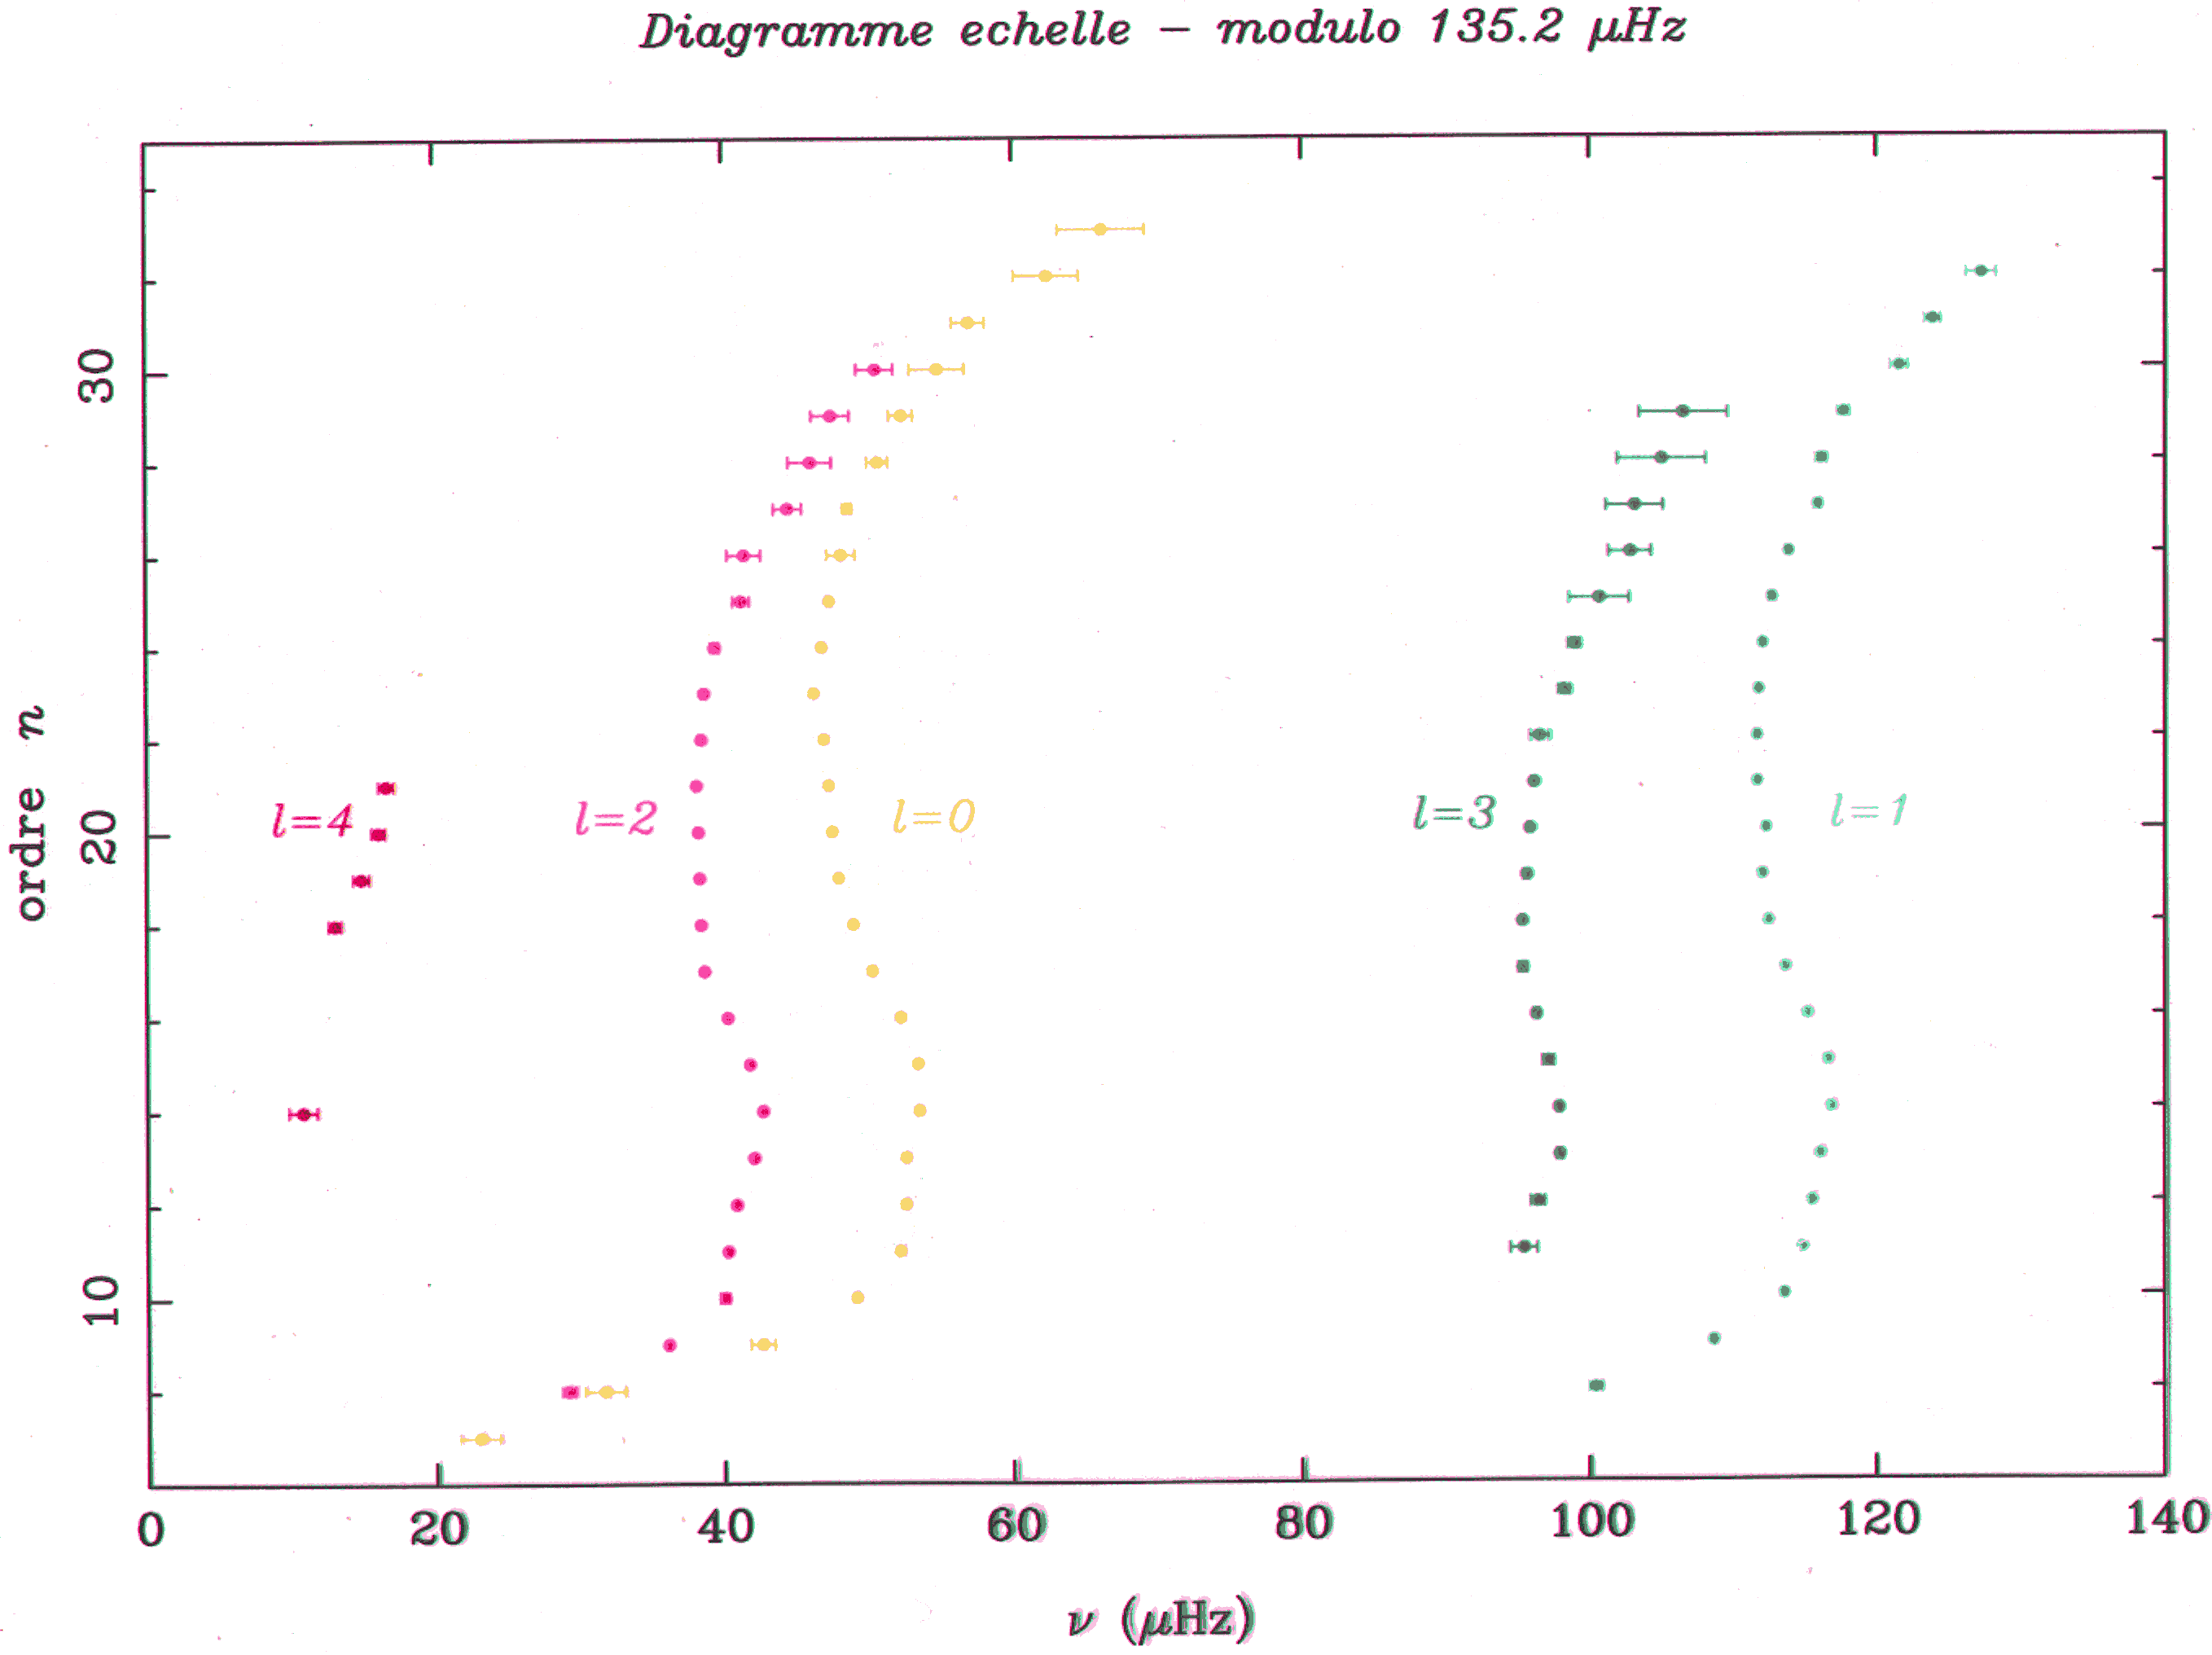 |
The frequency of the acoustical modes is displayed using an "echelle" spectrum, in which a periodic spectrum should give vertical lines. The periodicity of the spectrum, 135.2 milli Hertz, is related to the time needed for an acoustic wave to cross the sun. |
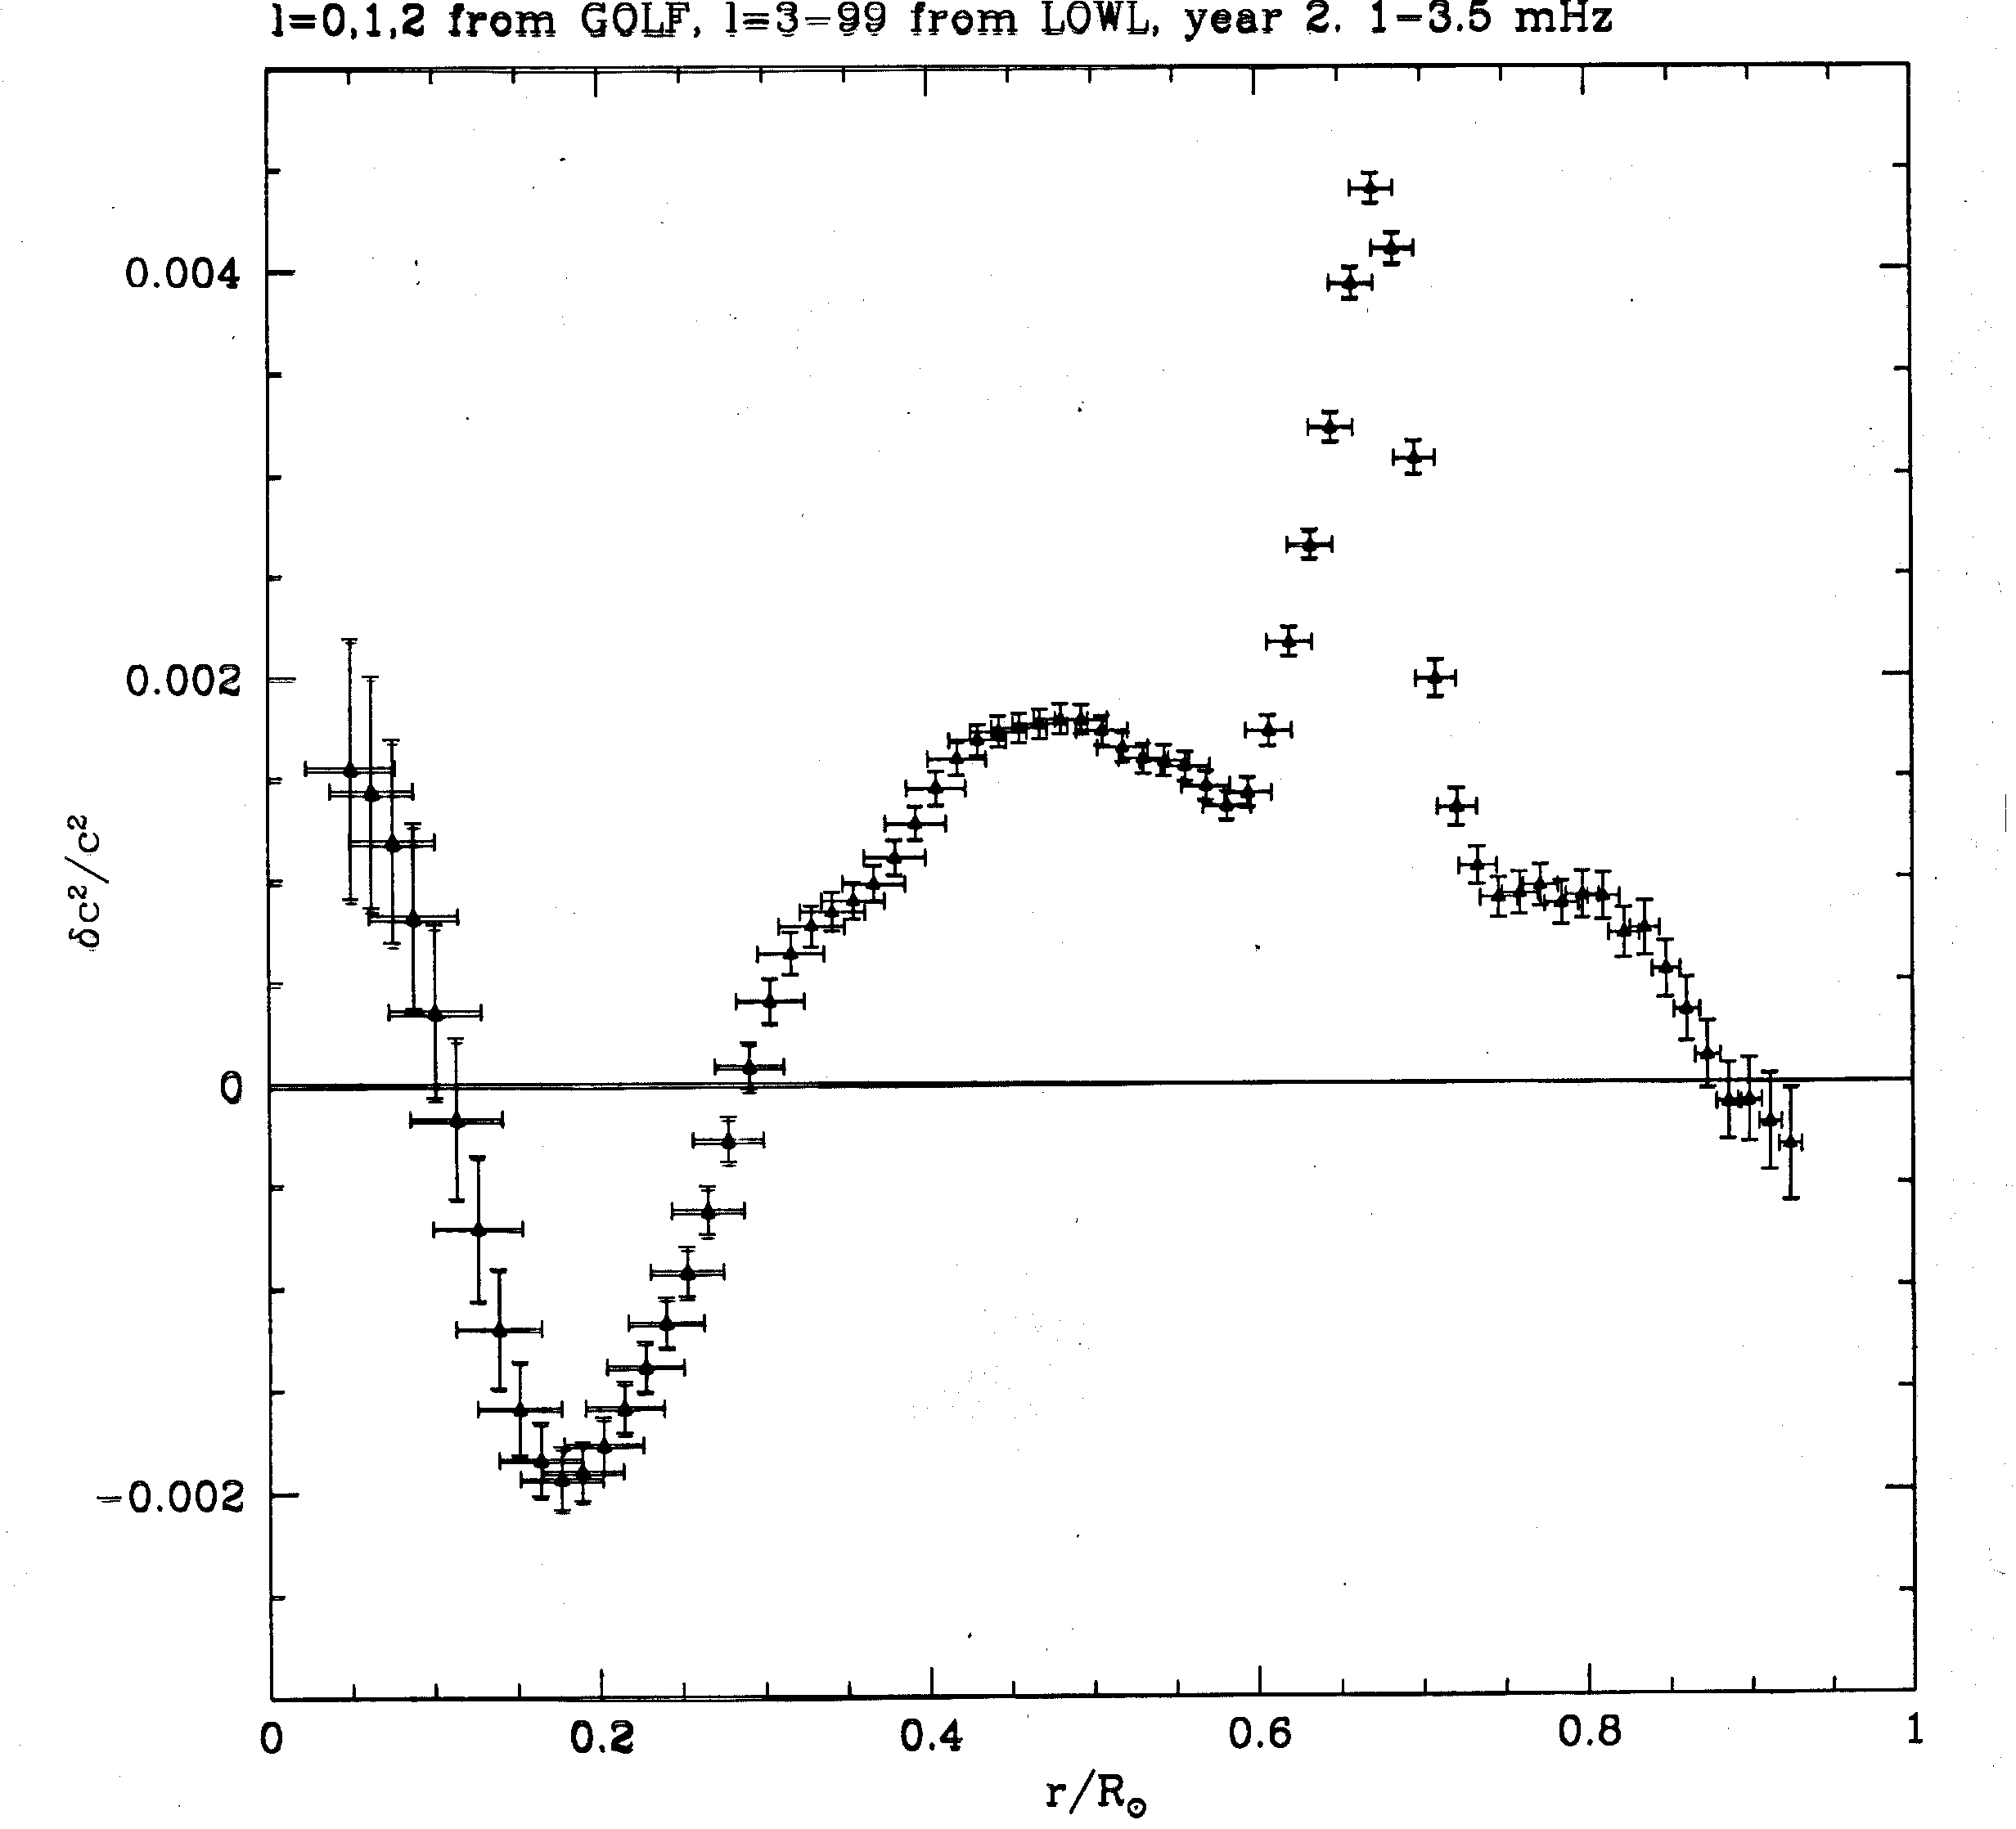
From the GOLF data, we can deduce the sound speed inside the sun. This
function coming from the observations is then compared to the function
issued from the solar model, and allows to adjust this solar model.
The difference of those functions shows mainly the limit of the convective
zone.
Increasing the frequency resolution, the modes of different tesseral
degree (m which characterize the equatorial to polar pattern) can
be resolved, leading to a direct measurement of the internal rotation.
That corresponds to the 27 days periodicity for the solar rotation.
Speaking of oscillations, the physical variable to observe is the velocity
(obviously the surface velocity). In the solar case, we can measure this
velocity and go in detail of the surface pattern of, looking at the Doppler
shift. In the star-like case, the velocity is averaged over the whole disk
and the measurement is obviously limited to the largest features,
the modes of low degree (from l=0 to l=2).
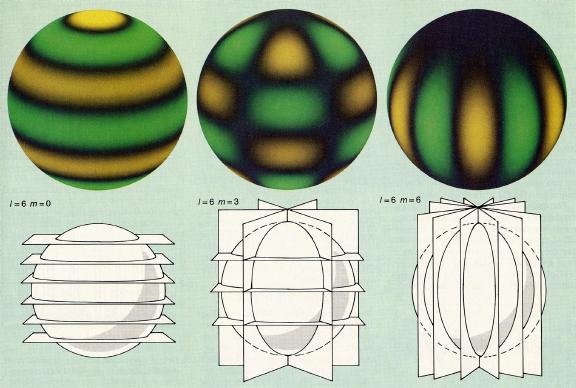 |
Toward low-degree harmonics: examples of l=6 for different value of
the tesseral degree m, polar mode to equatorial mode.
For the stellar observation, the averaged value remain zeroed, the only visible modes are from l=0 to l=2, for which a similar display shows only very few features. (For more developments, see GOLF, GONG , SOI, BISON and other helioseismology sites, the beginner's bibliography, the lecture notes on stellar oscillations by Jørgen Christensen-Dalsgaard.) |
The Doppler measurement uses a narrow optical band pass (like 100 milli
Angström). In the case of the brightest star, we have to search a
more light effective instrumentation in order to obtain a precise photometry.
The acoustical modes visible as velocity oscillations imply complex thermodynamics
effects in which pressure and temperature are not independent variable.
The oscillations result then in luminosity variations, measurable in micro
magnitude in the solar case. In counterpart, the luminosity changes
for the whole visible spectrum.
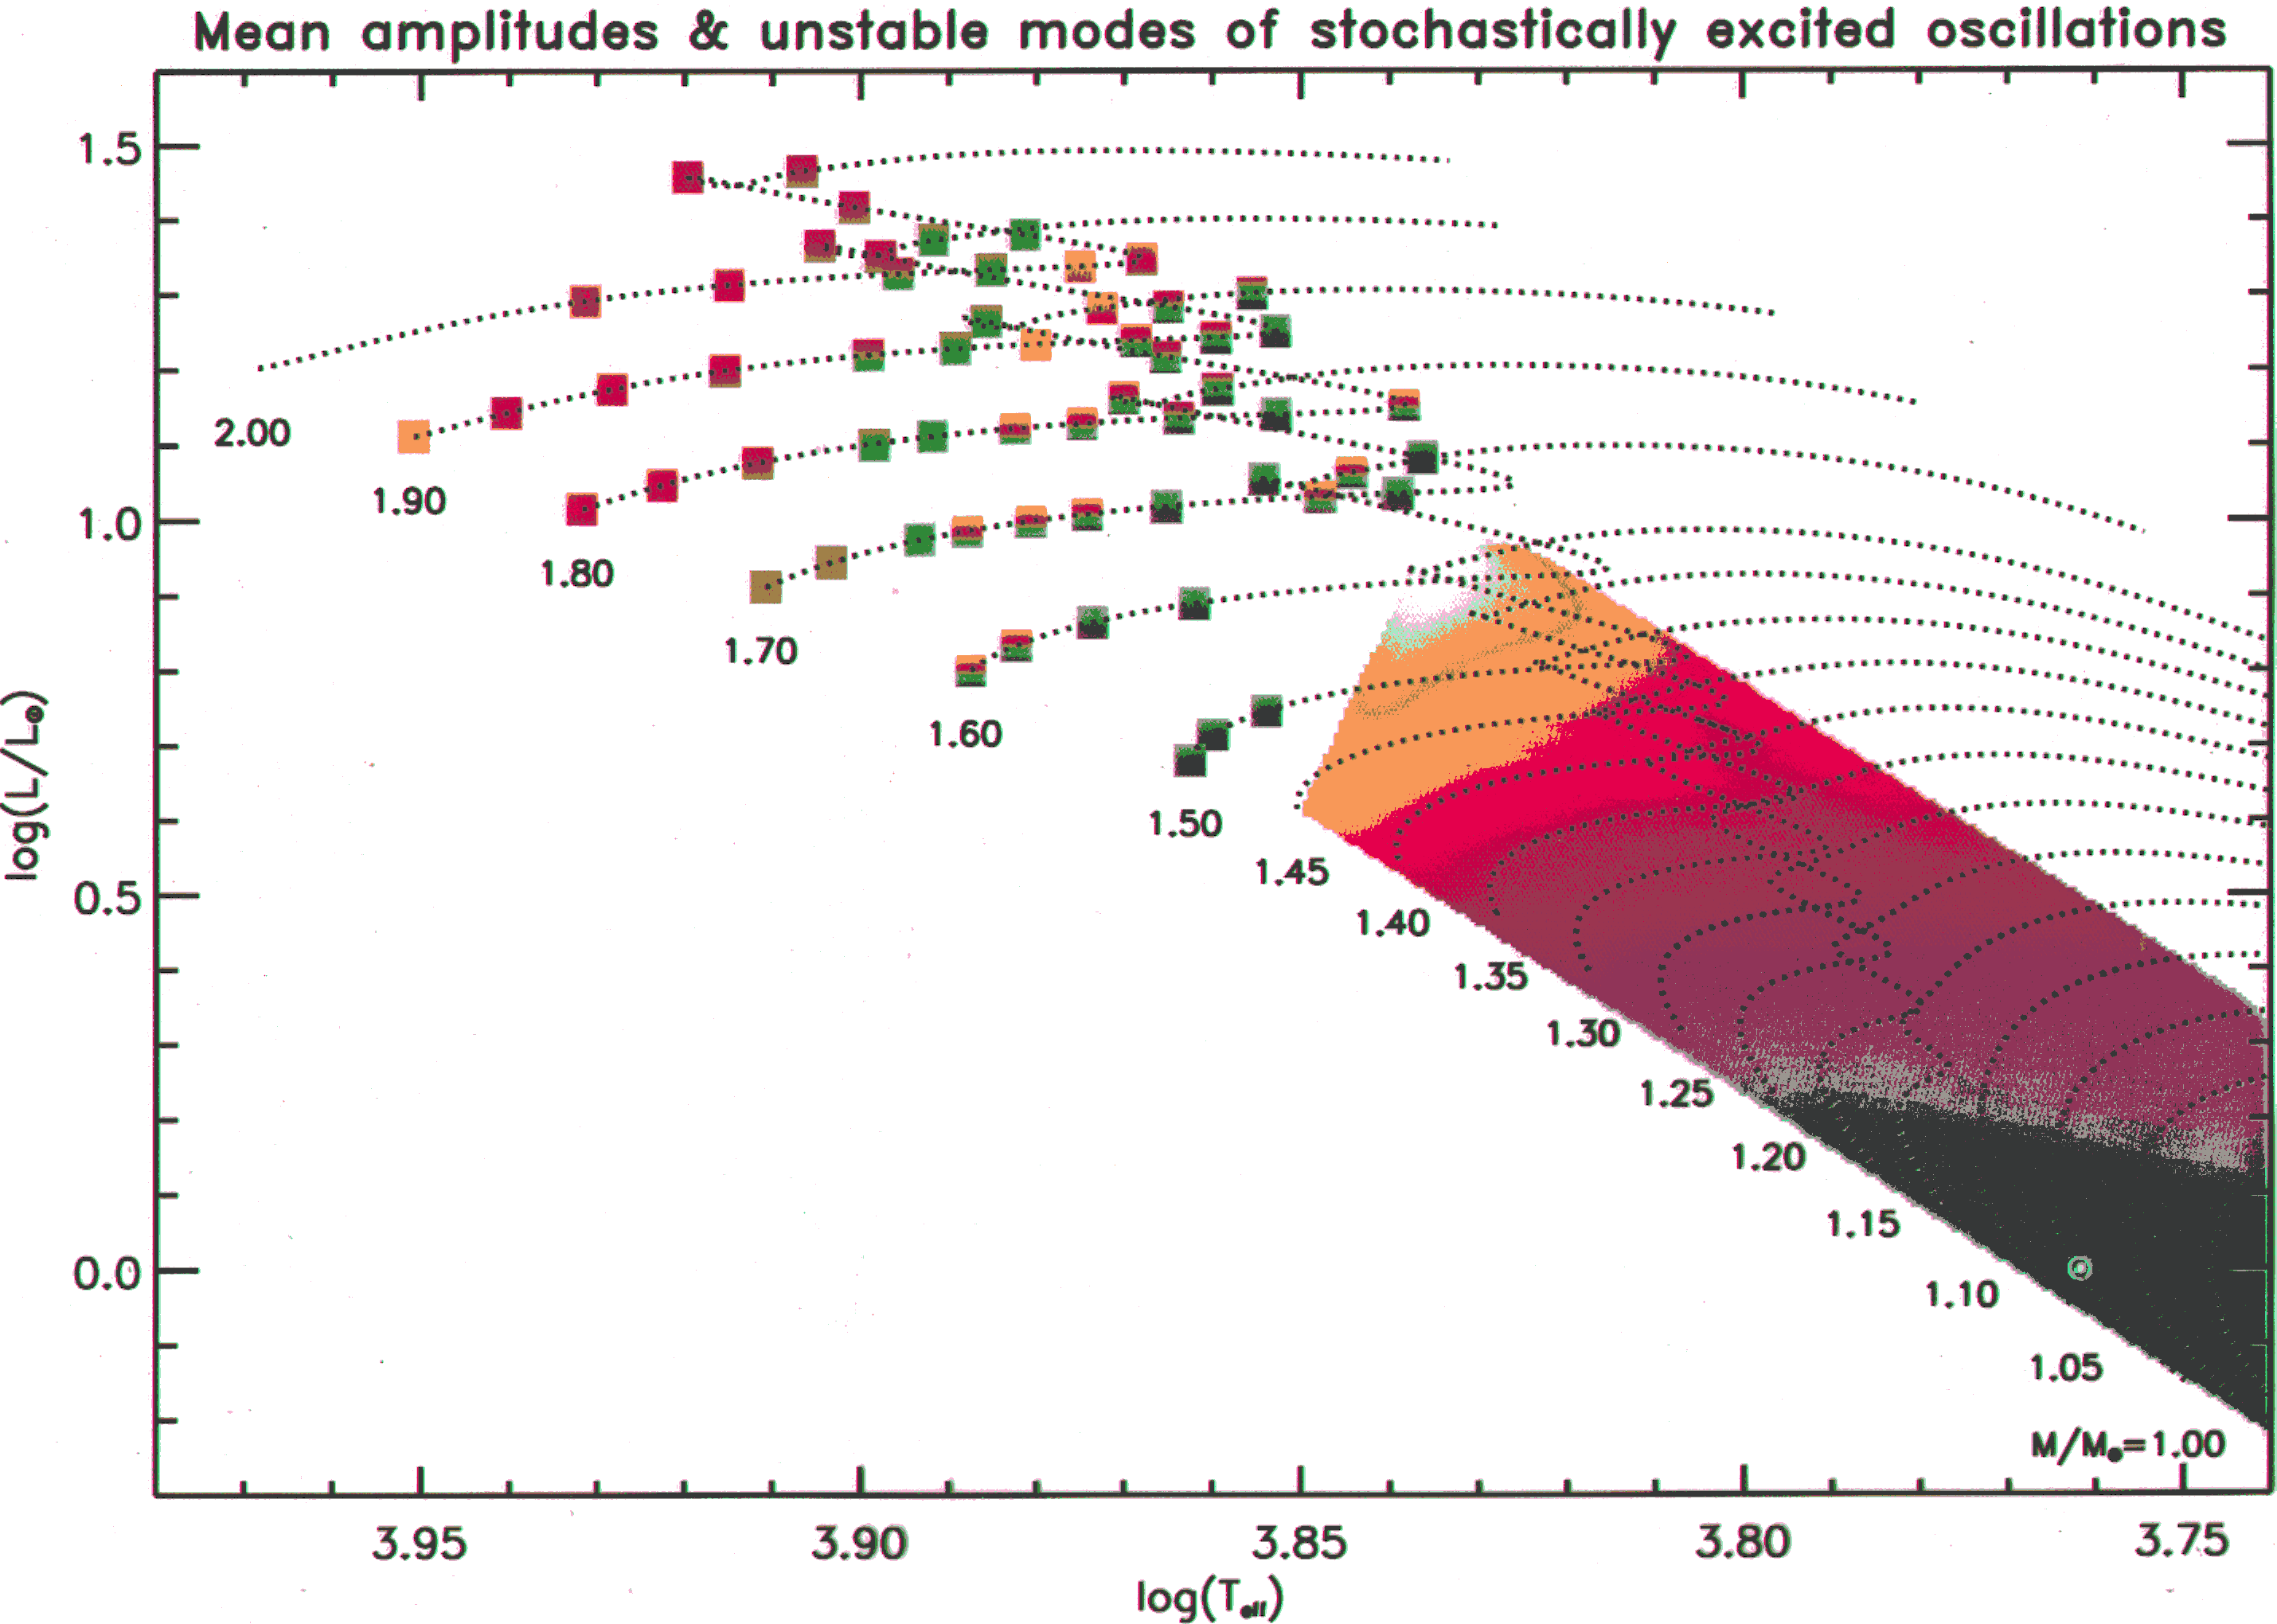 |
The amplitude of oscillation increases for the stars more massive than the sun, up to unstable modes (Houdek, thesis). The sun and the main components of alpha Cen are in the right bottom corner of the graph, the zone of stars with a low amplitude oscillations. |
The first campaigns from the dome C will be devoted to the observation
of alpha Cen.
This is the brightest star in the sky, with 2 mains components. The
spectral types are close to the solar type, the expected oscillations are
similar to the solar oscillations. That require an exceptionally good site
of observation allowing the measurement of fluctuations bellow the micro
magnitude - up to now only achieved from instruments in space. The 2 components
will be observable on 2 photometrical channels. A low crosswalk is achievable,
but that is not a key specification, as the 2 stars are not identical and
their spectra should differ.
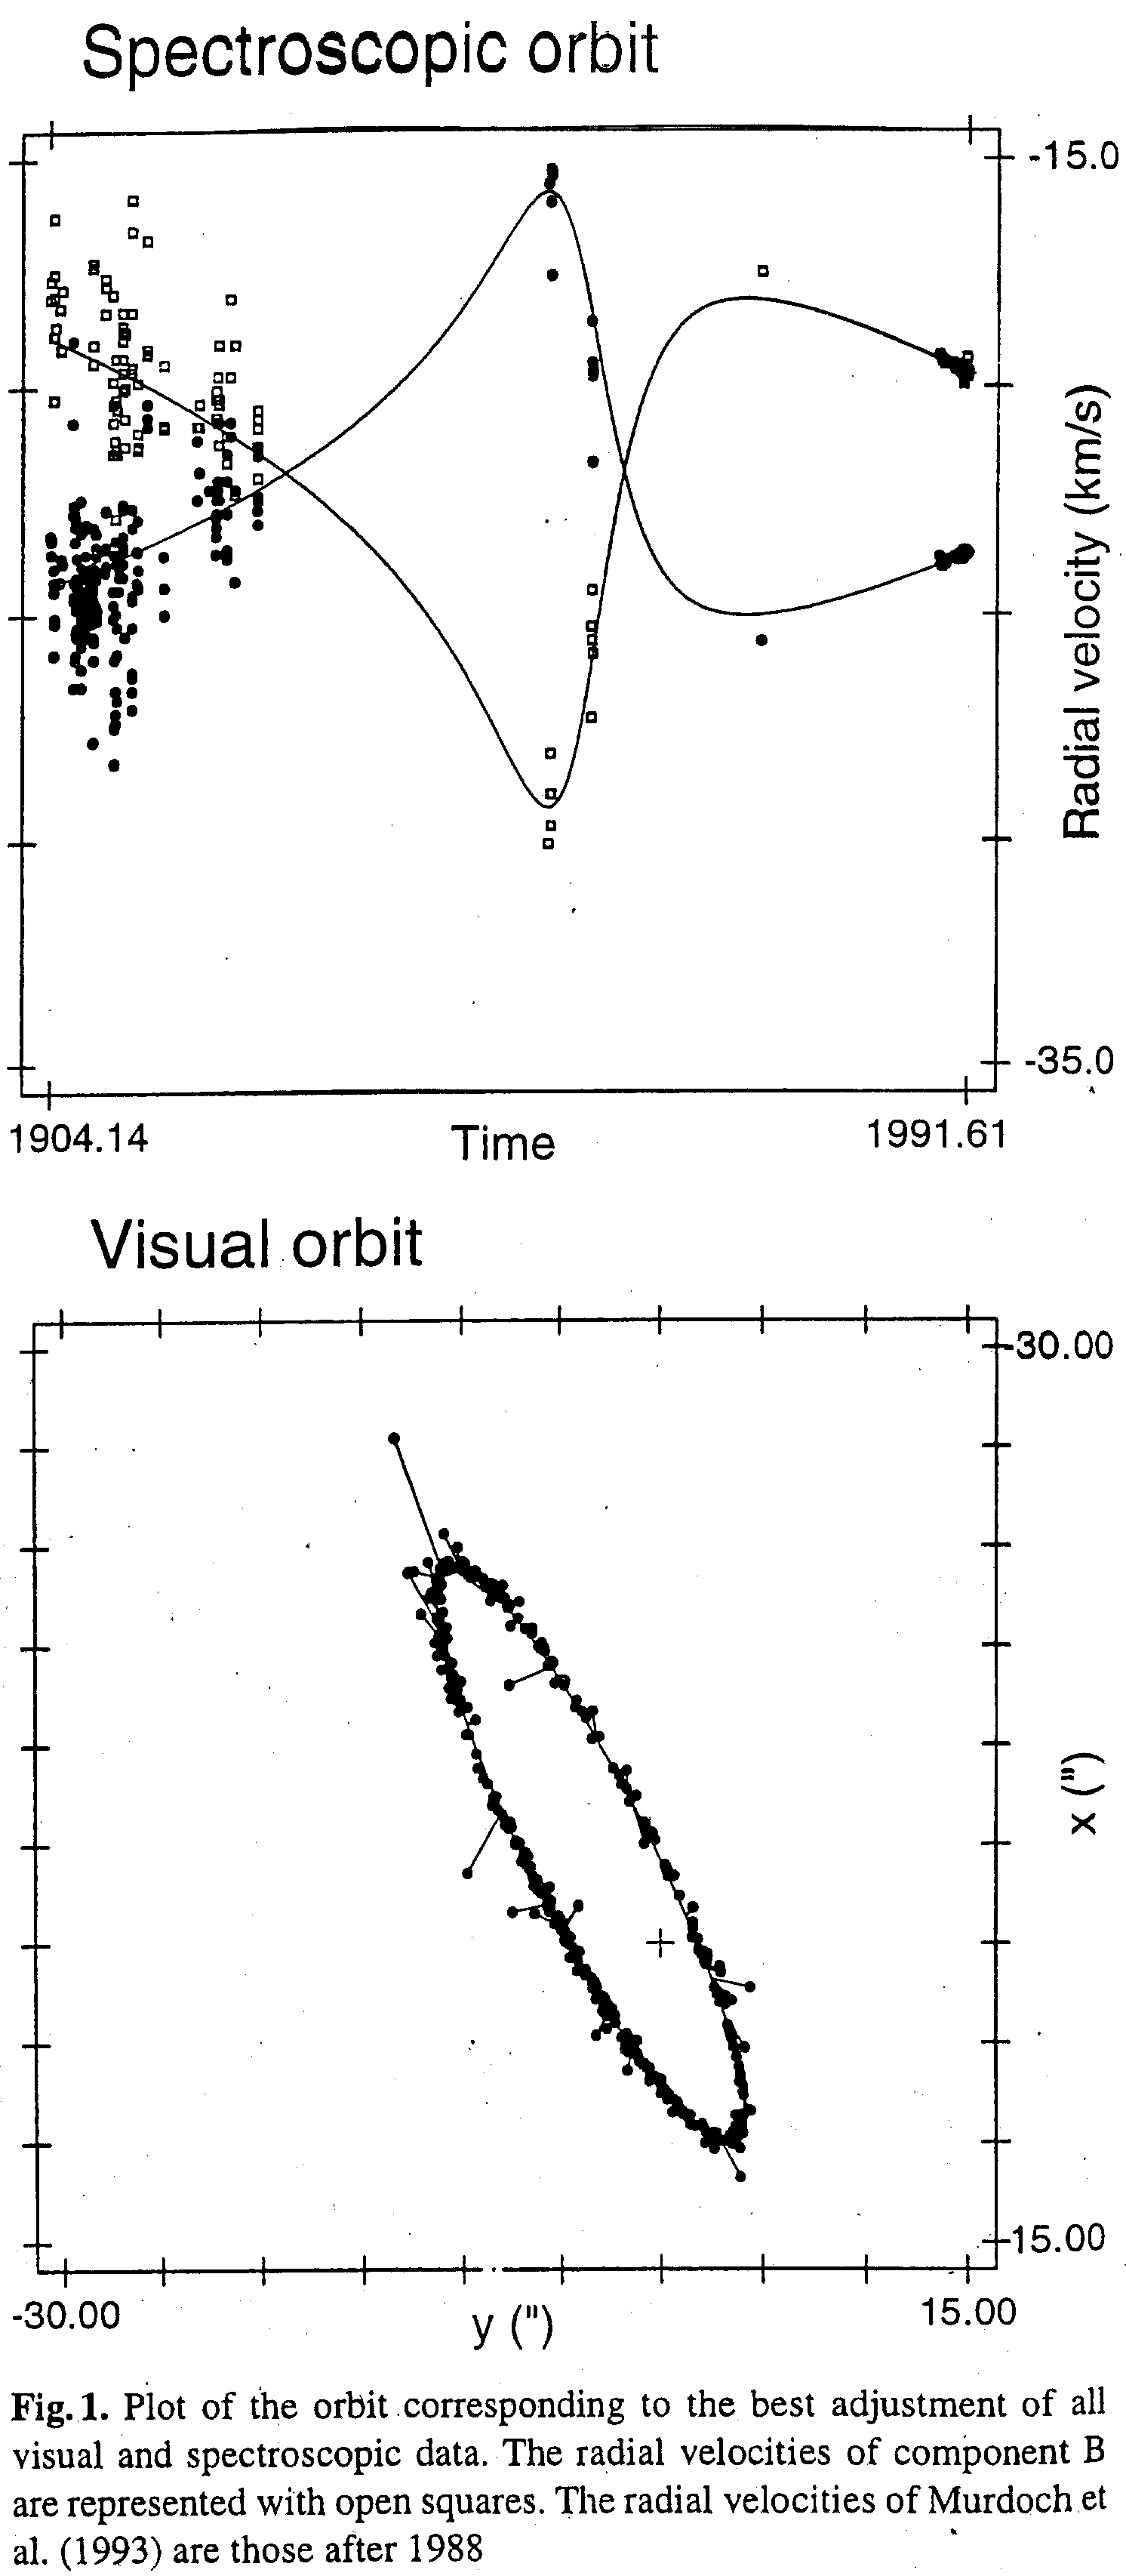 |
The orbit of alpha Cen, seen from the Earth.
(Pourbaix et al., 1999) |
back to home
Dernière modification le 8/1/2001
author G Grec.