PROSPECTS FOR ACHIEVING THE SPACEGUARD
GOAL
From our orbital- absolute
magnitude distribution model, we can easily compute the expected density
of NEOs
in the various regions of the sky, as well as their apparent
magnitude and rates of motion.
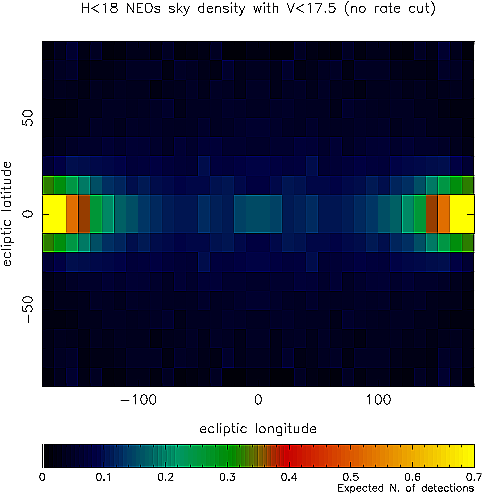 |
The sky density of NEOs with
absolute magnitude H<18 and apparent magnitude V<17.5.
The colors indicate the expected number of detections in each 10x10 degree
cell.
Coordinates are in ecliptic
latitude and longitude. Opposition
is at (0,0), while the position of the Sun is at (-180,0) and (180,0).
Notice that the NEO density has a local maximum near opposition, but the
absolute maximum density occurs near the position of the Sun. Unfortunately,
we cannot easily take advantage of this latter maximum, because ground
based surveys have difficulty observing close to the Sun. |
Using this NEO density chart,
we can investigate which survey strategies are capable of finding the largest
number of NEOs.
The current NEO discovery record
is dominated by the LINEAR
survey. To evaluate their prospects for future NEO discoveries, we
have developed a software simulator that mimics LINEAR's methods and properties.
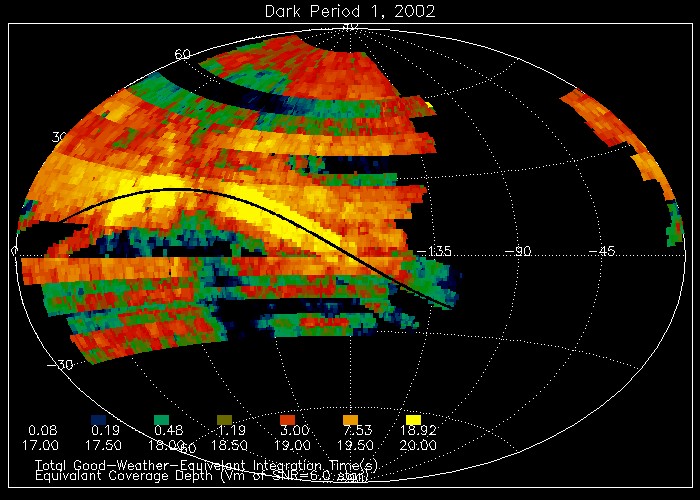 |
An example of LINEAR's monthly
sky coverage (from their website).
Using this kind of information, we have defined the sky coverage for our
LINEAR survey simulator. Our analysis of the discoveries reported by LINEAR
suggested that LINEAR's limiting
magnitude is, on average, V=18.5. Our survey simulator modeled
this by assuming 100% discovery
efficiency up to V=17.75, and a linear drop to 0% efficiency
at V=19.25. We also adopted LINEAR's typical minimum rate of motion for
NEO discoveries of 0.3deg/day. |
Our survey simulator does a remarkably good job at
reproducing the performance of the LINEAR survey. We have tested our results
in two ways:
TEST # 1:
| 273 NEOs with H<18
were known before January 1st, 1999, the appoximate date LINEAR began its
search for NEOs. Starting from that date, LINEAR discovered 176 new H<18
NEOs over the next 2 years. Our survey simulator takes 2.3 years to increase
the number of detected objects from 273 to 449, nearly the same amount
of time. |
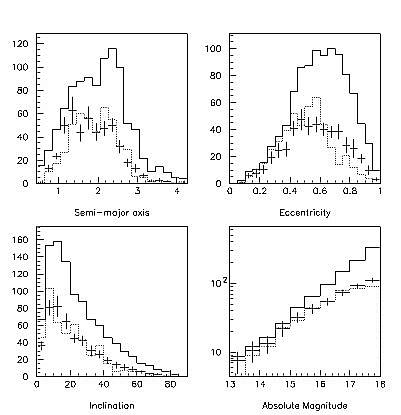
TEST #2:
| Our survey simulator does a
good job at reproducing the orbital and absolute magnitude distribution
of the 469 NEOs with H<18 which were discovered as of March 15,
2001. In this figure, the solid line represents the (a,e,i,H)
distribution of NEOs according to our model. The points with (1 sigma)
error bars give the distribution of the NEOs detected by our survey simulator
over several different runs.The dotted line represents the distribution
of the NEOs with H<18 discovered as of 15 March 2001. |
 |
Using our survey simulator we can investigate what
are the prospects for achieving the Spaceguard goal of discovering
90% of the NEOs with H<18 within the next 6 years. Unfortunately,
our predictions are quite discouraging:
1) LINEAR will achieve less than 70% completeness 6 years
from now.
2) ~40 years are needed to achieve the desired 90% completeness
with the current LINEAR survey.
3) to achieve the Spaceguard goal, a ground based survey
would not only need to have a better limiting magnitude than LINEAR,
but would also need improved sky coverage in order to detect objects closer
to the Sun.
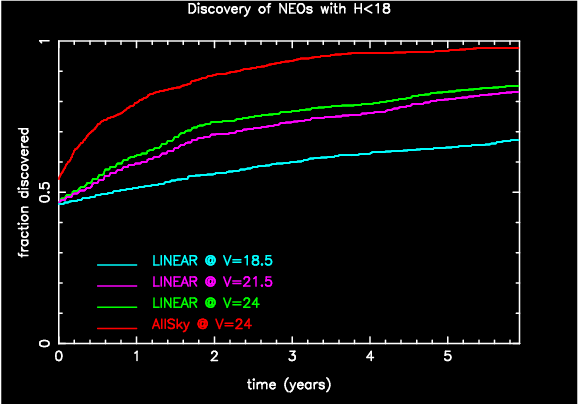 |
The expected observational completeness
of the H<18 NEO population during the next 6 years due to the
LINEAR survey (cyan curve). The magenta and the green curves show how the
situation would be improved if LINEAR's limiting magnitude were pushed
to 21.5 and 24.0 respectively, with the same monthly sky coverage. The
red curve shows the ideal case of a survey covering the entire sky visible
at night, up to a limiting magnitude V=24. It is unclear how
the proposed LSST survey
will approach this ideal limit. |
As illustrated by the above figure (compare the V=21.5
and V=24 curves), increasing the limiting magnitude too much is
useless unless the sky coverage is also
increased to include regions of the sky close to the Sun. In fact, for
a survey searching at opposition, pushing the limiting magnitude to higher
values is equivalent to pushing out the distance where
H<18 NEOs
can be detected. However this does not help because, according to our model,
most (85%) of the NEOs have aphelion
distances smaller than 4.5 AU.
The situation is even more discouraging if one wishes
to extend the Survey goal to the NEOs (or PHOs)
with H<20.5 (i.e., the bodies capable of producing 1,000 megaton
impact energies when striking the Earth). In this case, it would be necessary
to have a LINEAR-like system with limiting magnitude of at leastV=24,
in order to achieve ~90% completeness within the next 6 years.
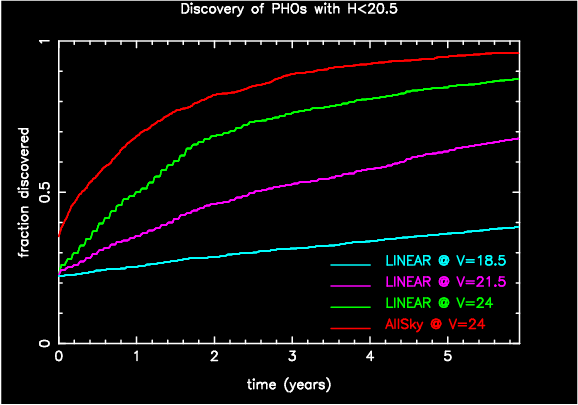 |
The expected observational completeness
of the Potentially
Hazardous Objects with H<20.5 during the next 6 years due
to the LINEAR survey (cyan curve). The magenta and the green curves show
how the situation would be improved if LINEAR's limiting magnitude were
pushed to 21.5 and 24.0 respectively, with the same monthly sky coverage.
The red curve shows the ideal case of a survey covering the entire sky
visible at night, up to a limiting magnitude V=24. |
NEXT
PAGE
PREVIOUS PAGE
FIRST PAGE