Years of work in the field of Celestial Mechanics have shown that the Near Earth Objects come mainly from 5 sources :
the nu6
resonance region at the inner border of the asteroid main
belt,
the 3:1
resonance region in the middle of the asteroid main belt,
the Intermediate
Mars-Crossing (IMC) population,
the Outer
Belt (OB) population and
the population of dormant
Jupiter
Family Comets (JFC)
|
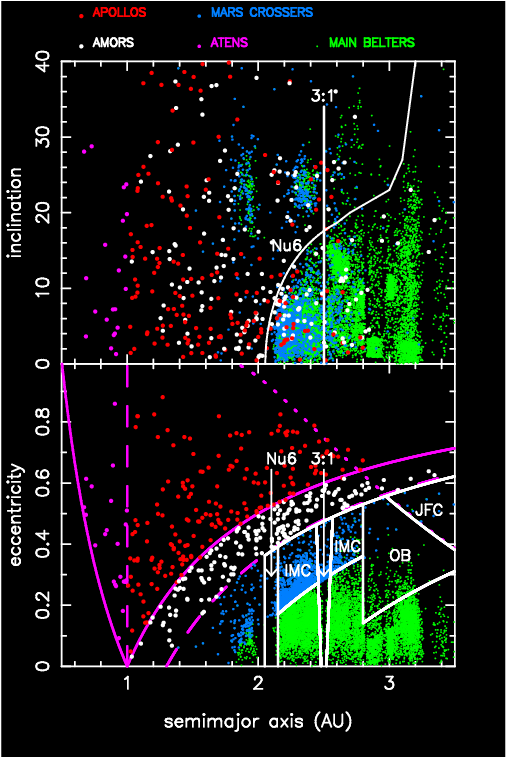
Orbital distribution of main belt asteroids (green), Intermediate Mars Crossers (blue) and NEOs (white, red and magenta). In the semi major axis vs. eccentricity plot, the source regions of the NEO population are bounded by white curves and labeled. In magenta, the solid curve bounds the Earth-crossing region; the dashed curve delimits the Amor region at q=1.3AU and the dashed vertical line denotes the boundary between the Aten and Apollo populations. The semi major axis vs. inclination plot shows the locations of the 3:1 mean motion resonance with Jupiter and the nu6 resonance. While the former occurs at 2.5 AU, independant of eccentricity and inclination, the location of the nu6 resonance is roughly independent of the eccentricity but is a function of the inclination. The boundary of the nu6 source region in the bottom panel is plotted for i=0. |
To compute the steady
state orbital distribution of the NEOs coming from each asteroid or
comet source we use the following strategy. We numerically integrate the
dynamical evolution of a large ensemble of test bodies initially
placed in various NEO source region(s) (click here
for an
). The test
bodies that enter the NEO region are tracked through a network of cells
in the (a,e,i) space until they hit the Sun, a terrestrial
planet, or are thrown from the inner solar system by a close
encounter with Jupiter. The mean time spent in each cell (called
residence time hereafter) is computed from the numerical data. The resultant
residence time distribution shows where the bodies from each NEO source
are statistically more likely to spend their time. As we know from statistical
mechanics, the residence time distribution is equivalent to the orbital
distribution of the steady state
population of NEOs originating from that source.
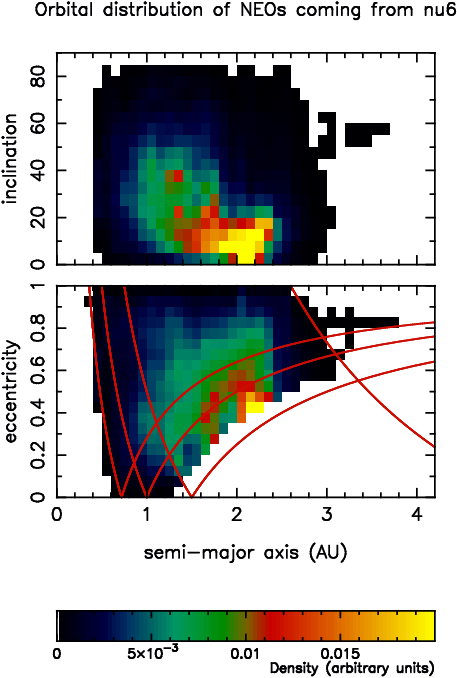 |
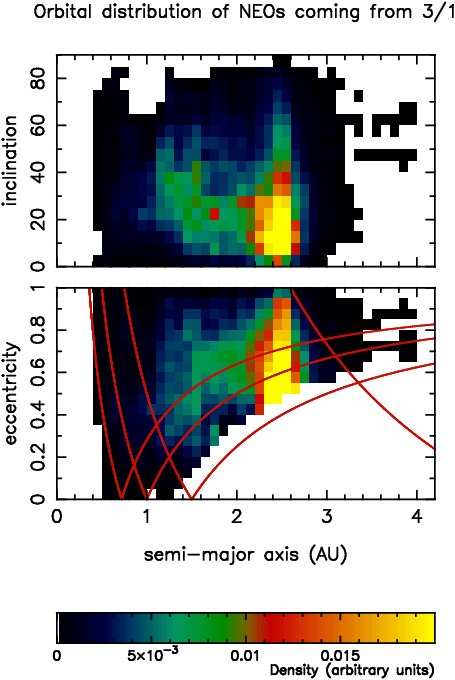
Steady state orbital distributions of the NEOs coming from the nu6, 3:1 and JFC sources, obtained by numerically computing the evolution of thousands of particles from their initial location in these sources, up to their ultimate dynamical elimination (collision with the Sun, with a planet, or ejection from the solar system; see ). The colors code the relative density of objects in the network of cells of the a,e and a,i planes. The red curves delimit the Venus-, Earth-, Mars- and Jupiter-crossing regions, respectively. |
 |
 |
To construct the NEO population, we linearly combine the steady state orbital distributions related to the 5 sources. The contributions of the sources to the overall NEO population is represented by 5 parameters, whose sum is 1.0. The NEO absolute magnitude distribution, assumed to be source-independent, is constructed so its shape can be manipulated using one additional parameter. Combining the resulting NEO orbital-magnitude distribution with the observational biases associated with the Spacewatch survey, we obtain a model distribution which can be fit to the orbits and magnitudes of the NEOs discovered or accidentally re-discovered by Spacewatch.
The resulting best-fit model nicely matches the distribution
of the NEOs observed by Spacewatch.
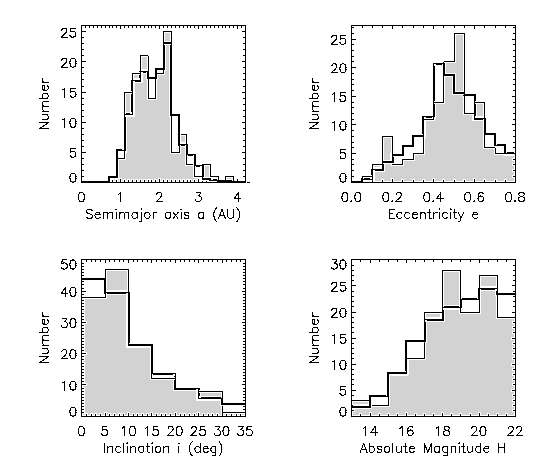 |
A comparison between the 138 NEOs detected by Spacewatch (shaded histogram) and our best-fit NEO model distribution (solid dark line), once the biases of the Spacewatch survey have been properly taken into account. We use the Spacewatch survey for this comparison, because their observational biases are well understood (Jedicke, AJ 111, 970, 1996). |
In our best fit model, the contributions of the
5 sources to the overall NEO population is:
| source | nu6 | 3:1 | IMC | OB | JFC |
| contribution | 37 +/- 8 % | 23 +/- 8 % | 25 +/- 3 % | 8 +/- 1 % | 6 +/- 4 % |