The albedo distribution in the
5 main sources is obtained through a main belt asteroid model, calibrated
on the color distribution observed by the Sloan
Digital Sky Survey (Izevic et al., Astron.
J. , 122, 2749, 2001):
| fraction* with albedo 2 - 9% | fraction* with albedo 9 - 11% | fraction* with albedo 11 - 35% | fraction* with albedo > 35% | |
| population in nu6 source | 7 % | 5% | 74% | 14% |
| population in 3;1 source | 10% | 4% | 79% | 7% |
| population in IMC source | 21% | 6% | 63% | 10% |
| population in OB source | 47% | 11% | 39% | 3% |
| population in JFC source | 100% | 0% | 0% | 0% |
From this, we deduce the albedo distribution of the
NEOs:
| fraction* with albedo 2 - 9% | fraction* with albedo 9 - 11% | fraction* with albedo 11 - 35% | fraction* with albedo > 35% | |
| NEO population | 20% | 5% | 65% | 10% |
From this albedo distribution we estimate that the
total number of NEOs with diameter D larger than 1 kilometre is
855 +/-110 which, compared to the total number of NEOs with H<18
(960 +/- 120), shows that the usually assumed conversion H=18 <=>D=1
km slightly overestimates the number of kilometre-size objects. The correct
conversion should be H=17.85 +/- 0.03 <=> D=1km.
|
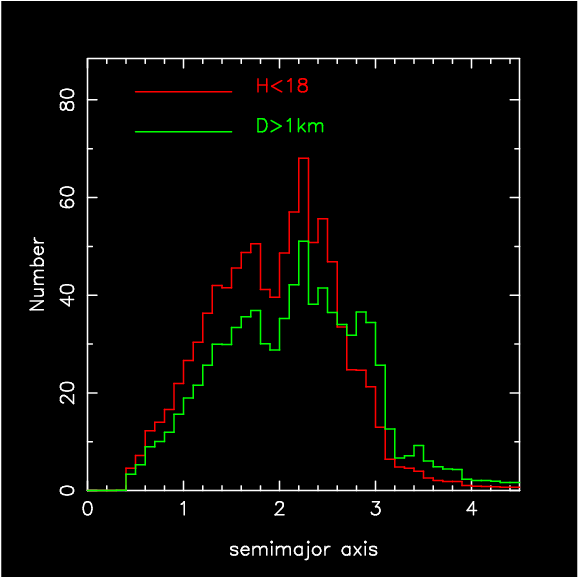
Comparison between the number of NEOs brighter than absolute magnitude H=18 and the number of NEOs larger than 1 kilometre in diameter, as a function of the orbital semi major axis. Because the dark NEOs come mainly from the outer main belt or are dormant cometary nuclei, their orbits typically have large semi major axis. Therefore, the NEOs with D>1 km outnumber those with H<18 for a>2.5 AU, while the opposite is true for a<2.5 AU. |
If we assume that most bodies with albedo smaller than 9% belong to the C taxonomic class, while the others belong to the S taxonomic class, we estimate that the C/S ratio in the NEO population should be ~0.25. This ratio is in agreement with the observed ratio (0.165 for H<20) once observational biases have been taken into account.