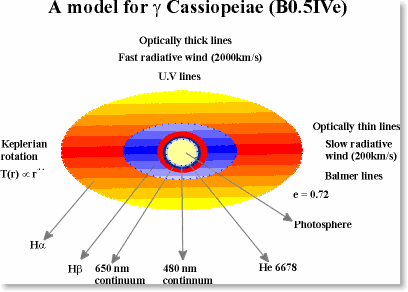
The stellar wind is at the origin of a two components, envelope, which is characterized by an equatorial plane with high density and low expansion where the Balmer emission lines are supposed to be formed. Whereas, a polar region with low density and high expansion is supposed to be responsible for UV absorption line profiles that are Doppler shifted with velocities up to 2000 km/s. This envelope also produce a linear polarization by free electrons of about 1.0-1.5%, and an IR excess that has been measured by IRAS.
Numerous ad-hoc models attempting to reproduce isolated characteristics of Be stars have been proposed in the past (Poeckert and Marlborough 1978; Waters & Marlborough 1992). They try to fit a few observable features by constraining as many free parameters as possible. We propose a strategy which lies between a totally ad-hoc and a physically consistent approach which starts from the hydrodynamic equations in the polar regions in order to provide the density distribution and the velocity fields throughout the envelope. Moreover, this approach enables us to produce intensity maps as a function of wavelength and introduce high angular resolution data in our model by computing theoretical visibilities.
We have built a model producing both spectroscopic and interferometric synthetic data that have been compared to the GI2T observations. This model is a latitude-dependent radiative wind numerical code for Be stars which clearly shows that the morphology of the circumstellar envelope depends strongly on the central observational wavelength and bandwidth. The line force in our model is the same as used by Friend & Abbott (1986), but we introduce a varying contribution of thin and thick lines from pole to equator by adopting radiative parameters which are latitude-dependent. The velocity fields and density relationships derived from the hydrodynamic equations are then used for solving the statistical equilibrium equations. By adopting the Sobolev approximation, we could easily obtain a good estimate of both electronic density and hydrogen level populations throughout the envelope. The numerical calculation was performed for parameters characterisic of the Be star γ Cassiopeiae.
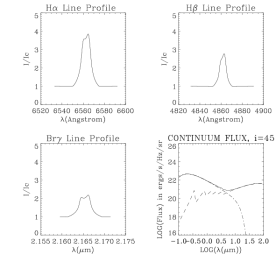
Exemple of line profiles with parameters representative of the Be Star
γ Cas computed with SIMECA. Lower right corner: Energy distibution as
a function of wavelength (dashed line: envelope flux , dash-dot line: stellar
flux, solid line: total flux)
We have obtained an Hα emission profile from our rotating and expanding wind model that is in good agreement with the observed spectra. Our computed intensity maps, in both the continuum and Halpha, agree reasonably well with maps derived from actually observed visibilities. We have also computed intensity maps across the Hα line in order to obtain the change in visibility as a function of Doppler shift across the emission line. The maps are symmetrical around the central wavelength due to the fact that our model is axi-symmetric. A comparison with the visibility obtained from these maps and the GI2T data is shown bellow for the 20.7 meter baseline. The agreement is good within errors bars of the data. This agreement is important because due to the structure of the velocity field in the envelope, its morphology strongly depend on the central observational wavelength
and bandwidth. Finally the model indicates that a radiative wind, driven mainly by optically thin lines at the equator, is a likely scenario for γ Cas. This is discussed in greater depth in Stee, Ph. and Araujo, F.X. 1994, "Line profiles and intensity maps from an axi-symmetric radiative wind model for Be stars", 1994, A&A, 292, 221
Some results obtained with SIMECA
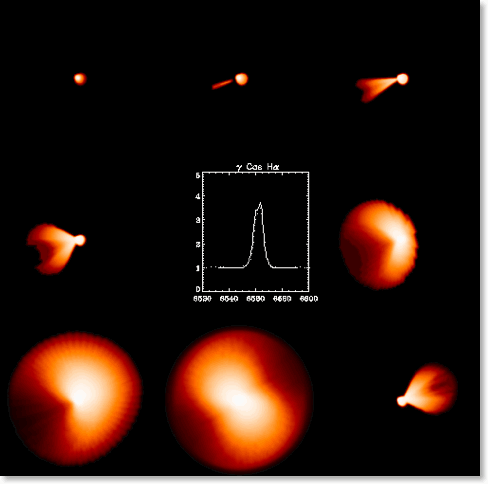
Intensity maps from our model of the Be star γ Cassiopeiae at different Doppler-Shifts across the Hα emission line.
Respectively from the left to the right and from the top to the bottom: 6532, 6542, 6546, 6550, 6554, 6558, 6562 et 6574 Angstrom.
Each map is computed within a spectral band of 4 Angstrom.
From these maps theoritical visibilities are computed and compared to GI2T data. At the center: Hα emission line obtained from the same model.
You can obtain our results on γ Cas in: Stee, Ph., de Araujo, F.X., Vakili, F., Mourard, D., Arnold, L., Bonneau, D., Morand, F., and Tallon-Bosc, I. 1995, "Gamma Cas revisited by spectrally
resolved interferometry", A&A ,300, 219.
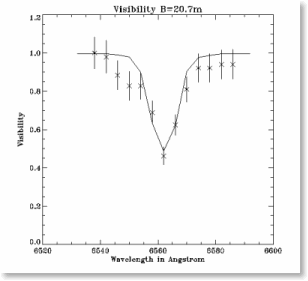
Visibilities corresponding to the previous intensity maps across the Hα emission line for an interferometric baseline of 20.7 meter.
Solid line: model, crosses: GI2T's data. If you are interested see: "γ Cas revisited
by spectrally resolved interferometry", A&A, 300, 219
We have also studed the rotational velocity law in the envelope of γ Cas. We have shown that Keplerian rotation seems to be the better law and that only Differential-Spectro-Interferometry can distinguish between these different velocity laws. If you are interested see: "On the Kinematics of the Be star γ Cassiopeiae", A&A, 311, 945. Here is an exemple from this paper:
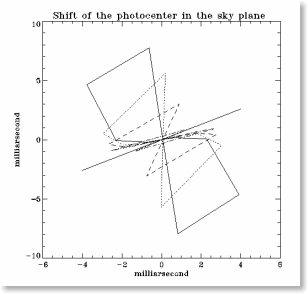
Shift of the photocenter of each map in the sky plane. The solid thick
line is the direction of the rotation axis. Each visibility point is computed
within a 4 Angstrom bandwidth. Solid line: constant rotation., dotted:
beta=0.25, dashed: Keplerian rotation, dash dot line: angular momentum
conservation. If you are interested see:"On the Kinematics of the Be star
γ Cassiopeiae", A&A, 311, 945
Finally here is a global picture of γ Cas circumstellar environment:
