Using SIMECA, we have computed intensity maps in the Brγ line profile and in the continuum at 2.16 μm (see the following Figure) with stellar and wind parameters defined in A&A ,300, 219. From these maps (plotted with the same iso-contour dynamic) it is clear that the extension of γ Cas is very large in the near-IR. The maximal extention in the North-South direction is 41 stellar radii at 2.16 μm. This is mainly due to the fact that at IR wavelengths the contribution from the star is less important compare to the one from the envelope. Thus, the contrast between the star and the envelope is less pronounced and the objet (star+envelope) appears more extended. In other words, in the near-IR you are not ``dazzled'' by the central star and you are able to ``see'' at larger distances the surrounding matter.
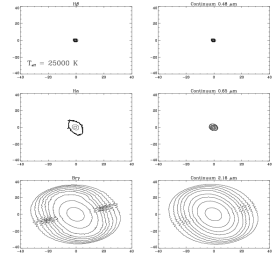
Intensity maps with parameters representative of the Be Intensity maps with parameters representative of the Be Star γ Cas computed with SIMECA.
From the upper left to the lower right respectively in the Hβ line, Continuum at 0.48 μm, Hα line, Continuum at 0.65 μm, Brγ line, Continuum at 2.16 μm within a spectral bandwith of 40 Angstrom.
The axis are in stellar radius. Northis up, East is left.
What are the predicted Near-IR, visible line profiles and intensity maps for a given set of stellar parameters ?
We present in "Near-IR and visible interferometry of Be stars: Constraints from wind models, A&A, 367, 532 (2001)" theoretical HI visible and near-IR line profiles and intensity maps for a large set of parameters: density, temperature, envelope geometry, inclination angle, representative of early to late Be spectral types. We also predict theoretical visibilities that can be used to interpret interferometric measurements and constrain the circumstellar environment of Be stars.
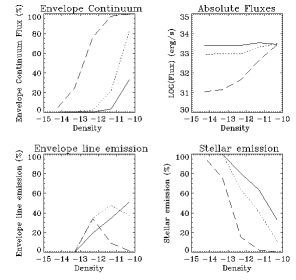
Predicted flux contribution (in %) as a function of the wind density at the base of the photosphere
(Log scale).
Upper left: envelope continuum flux, Upper right: Log of the absolute fluxes in erg/s.
Lower left: emission of the envelope in the line.
Lower right: stellar contribution. (see A&A, 367, 532 (2001) for details).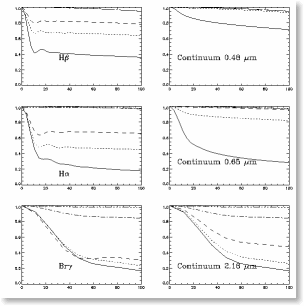
Density effect on the visibility curves as a function of baseline (in meters) for different lines. For each graph the curves are the following: ρ =5 10-11
( solid line), 5 10-12 (dotted), 5 10-13 (dashed), 5 10-14 (dash-dot) and 5 10-15 (dash-dot-dot-dot). (see A&A, 367, 532 (2001) for details).
We obtain in "Estimation of the mass loss, opening angle and mass of Be circumstellar disks from Brγ continuum emission and interferometric measurements" A&A, 403, 1023 (2003) a correlation between the mass loss rates and the Brγ continuum luminosity as a function of the opening angle of the disk. We show that this correlation is similar to those obtained by Scuderi et al. 1998, A&, 332, 251 for O-B supergiants. We found that the wind density at the base of the photosphere, from a sample of 8 Be stars, lies between 10-13 and 10-12 g/cm3. We also present a relationship between the mass of the circumstellar disk and the 2.16μm flux. Finally we emphasize how interferometric measurements can help to estimate the wind density and we present a sample of 16 Be stars with predicted visibilities that can be observed with the VLTI.
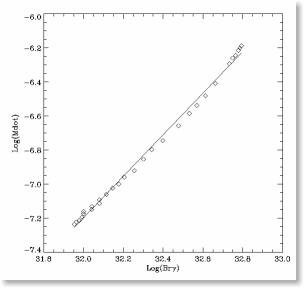
Relationship between logarithm of the mass loss of the star and the logarithm of the Brγ continuum emission. This correlation is of the same nature has found by Scuderi et al. A&A 332, 251 (1998) for O-B supergiants. (see A&A, 403, 1023 (2003) for details)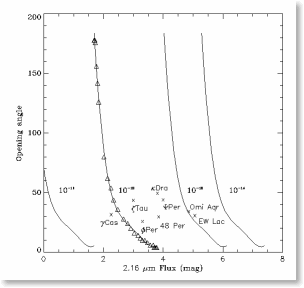
Relationship between the disk opening angle in degree and the 2.16 μm flux (in magnitude) for different densities at the base of the stellar photosphere indicated on the plot (in g/cm3).
We have overplotted the opening angles and the 2.16 μm flux determined by waters et al. A&A, 185, 206 (1987). (see A&A, 403, 1023 (2003) for details)